
-
Why glass matters: history and basics3 Topics
-
Where and how glass is used today3 Topics
-
State of glass waste and recycling3 Topics
-
Collection systems and actors3 Topics
-
Sorting, processing and making cullet3 Topics
-
Remelting, quality and markets3 Topics
-
Environmental, economic and policy aspects3 Topics
-
Practical implementation and teaching resources3 Topics
Participants 9


Africa / South Africa / comparable countries

travellingteacher256 April 13, 2026
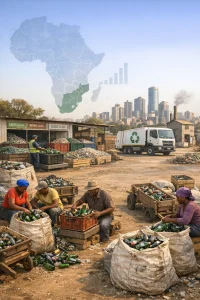
Quick intro: data on glass recycling in Africa is patchy. Where we do have numbers they vary a lot by country and city. Still, some clear patterns emerge: formal collection systems are limited, informal collectors play a big role, and few countries have nationwide systems that reliably recover large shares of container glass. Below I give concise, evidence‑based guidance you can use to make a one‑page summary for learners, plus pointers to short reports and data sources.
Typical recovery rates (what you can expect)
- Regional gist: municipal recycling in sub‑Saharan Africa is generally very low — often single digits to low‑teens percent for all recyclable materials combined. Glass-specific recovery is usually low too, but can be higher in places with bottle reuse or targeted programmes. (See World Bank “What a Waste 2.0” and ISWA/Waste Atlas country profiles.)
- Typical ranges you will see in studies and reports:
- Many cities/countries: 0–20% of glass collected for recycling (often <10% in poorer urban systems).
- Cities with active informal collection or targeted schemes: 10–40% recovered.
- Outliers (countries or regions with remelt capacity / schemes): >50% recovery is possible but uncommon in the Global South outside a few better‑resourced economies.
- South Africa: performance is better than the African average, but not universal. Expect markedly higher recovery in major metros (because of buy‑back centres, private collection and remelters) and much lower recovery in rural/underserved areas. (Use national waste reports for precise provincial figures.)
Notes: numbers above are indicative ranges synthesised from waste sector reviews (World Bank, UNEP, ISWA). Exact country figures vary by study year and method. Glass is often under‑reported or lumped with “containers” in national MSW statistics.
System coverage — how glass gets collected in Africa (typical models)
- Municipal kerbside recycling: limited coverage, mainly in wealthier suburbs and some metros.
- Drop‑off / bottle banks / buy‑back centres: common where there is a market for cullet; these are important in South Africa and some larger cities.
- Informal sector (waste pickers, itinerant buyers): very important across Africa — they recover bottles and other glass, often before municipal services intercept waste. Informal actors supply material to local aggregators or small recyclers.
- Reuse/refill systems: still present for some beverage bottles in several countries — reuse delays the need for remelting and is a form of circularity.
- Small local remelters and artisanal recyclers: exist but are few and often capacity‑limited; transporting cullet long distances to remelters raises costs.
- Deposit‑return schemes (DRS) and extended producer responsibility (EPR): rare in Africa; where present (pilot or local schemes), they dramatically raise recovery.
Coverage varies widely within countries — large metros may have several collection routes and processors, while smaller towns have almost none.
Common barriers to higher glass recycling in African contexts
- Data gaps & weak monitoring
- Many national waste statistics do not disaggregate glass or only report reuse; inconsistent methods make comparisons difficult.
- Low value of cullet / poor market signals
- Mixed‑colour or contaminated glass fetches little or no price; transport costs can exceed value.
- Contamination and sorting challenges
- Mixed or broken glass, ceramics, stones, and organics reduce remelt quality and value.
- Lack of nearby remelt capacity
- Few furnaces/remelters; long transport distances increase carbon and cost, discouraging collection.
- Fragmented collection & logistics
- No separate glass streams at source; municipal services focus on bulk waste collection, not material recovery.
- Limited policy instruments
- Few deposit‑return schemes, limited EPR coverage for glass packaging, and weak enforcement.
- Social & economic factors
- Informal sector not formally integrated (lack of PPE, health & safety, fair pay); exclusion reduces system efficiency and equity.
- Poor infrastructure & financing
- Lack of capital for sorting facilities, container banks, and investment in remelts, especially in smaller cities.
What statistics usually show (headline patterns)
- National averages often hide strong urban/rural differences: a country may report a modest recycling rate while a few cities actually perform reasonably well.
- Reports commonly mix “reuse”, “recovery by informal sector”, and “recycling” — always check definitions.
- Where formal schemes exist (DRS, EPR, municipal collection and buy‑back networks), recovery jumps — but these are still rare in Africa.
- Informal recovery can be a significant share of recovered glass but is invisible in many official stats.
- Countries comparable to South Africa (upper‑middle income, larger urban economies) often show much better results than lower‑income neighbours — mainly due to processing capacity and private sector investment.
Practical notes for educators / learners
- When reading a statistic, ask: does this include reuse? Does it count informal recovery? Is it national or city level?
- Useful short metrics to teach: recovery rate (%) = mass of glass collected for recycling ÷ mass of glass placed on market or disposed; cullet share in furnace mix (%) — these are simple but powerful.
- Emphasise system, not just material: policy (DRS/EPR), collection design, and local remelt access matter more than the simple “value” of glass.
Short, reliable data sources & briefs to consult (concise & accessible)
(These are good starting points for country/regional snapshots and short summaries suitable for educators.)
- World Bank — “What a Waste 2.0: A Global Snapshot of Solid Waste Management to 2050” (2018). Solid overview of regional waste generation and recycling trends. Good for MSW context and regional comparisons.
- https://openknowledge.worldbank.org/handle/10986/30317
- ISWA / Waste Atlas — country profiles and maps. Quick, visual country pages with basic waste and recycling stats (varies by country).
- https://www.wasteatlas.org
- UNEP — “Global Waste Management Outlook” (2015) and related short policy briefs. Good for policy framing and environmental impacts.
- https://www.unep.org/resources/report/global-waste-management-outlook
- African Development Bank / UNEP regional briefs — look for country or regional waste management briefs (short, policy‑oriented).
- Search: “UNEP Africa waste country profile [country name]”
- National sources (best for precise SA/Uganda data):
- South Africa: Department of Forestry, Fisheries and the Environment (DFFE) / National Waste Management Strategy / National Waste Information Baseline reports. Also industry/sector reports (e.g., Glass recyclers’ associations, local remelter publications).
- Search: “South Africa National Waste Management Strategy” and “South Africa waste information system (SAWIS)”.
- Uganda: Ministry/City reports and academic case studies on Kampala’s informal recyclers — useful for qualitative snapshots.
- South Africa: Department of Forestry, Fisheries and the Environment (DFFE) / National Waste Management Strategy / National Waste Information Baseline reports. Also industry/sector reports (e.g., Glass recyclers’ associations, local remelter publications).
- Academic/policy reviews (short syntheses):
- Look for review articles titled “solid waste recycling in sub‑Saharan Africa” or “informal recycling in African cities” — these often have compact tables on material recovery.
- Example search: Google Scholar “glass recycling Africa review” or “glass waste Uganda recycling”.
How to use this in a one‑page learner summary
- Lead with a short headline: “Glass recycling in Africa: patchy but critical — many countries recover small shares, with informal collectors playing a big role.”
- Give 3 quick numbers (use ranges): e.g., “Typical city recovery: 0–40%; many countries <20%” (cite World Bank/ISWA).
- List the 3 most common collection routes (kerbside, buy‑back/drop‑off, informal).
- Bullet the top 4 barriers.
- Finish with 2 actionable notes: (1) check whether stats include reuse/informal recovery, (2) look up national waste agency or Waste Atlas for country profile.
If you want, I can:
- Draft a one‑page learner sheet based on the bullets above, tailored for South Africa or Uganda specifically (I’ll pull the most recent national report snippets and format them simply), or
- Pull a short reading list of 4–6 <30‑page briefs and provide direct links and one‑line descriptions for each.
Which would help you most next?