
-
Why glass matters: history and basics3 Topics
-
Where and how glass is used today3 Topics
-
State of glass waste and recycling3 Topics
-
Collection systems and actors3 Topics
-
Sorting, processing and making cullet3 Topics
-
Remelting, quality and markets3 Topics
-
Environmental, economic and policy aspects3 Topics
-
Practical implementation and teaching resources3 Topics
Participants 9


State of glass waste and recycling

travellingteacher256 April 13, 2026
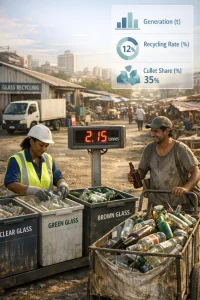
Lesson introduction — State of glass waste and recycling
Welcome — this lesson gives you a compact, evidence‑based snapshot of how much glass is thrown away, how much gets recycled, and where to look for reliable data for the Global South. The aim is practical: after this lesson you’ll be able to explain current patterns in glass waste and recycling, compare a few regional realities (including Africa / South Africa / similar countries), and find short, trustworthy reports you can turn into 1‑page teaching summaries.
Why this matters (quick)
- Glass is valuable and infinitely recyclable, but recycling performance varies hugely by place.
- Knowing the scale (tonnes) and the simple metrics (recovery/recycling rate, cullet share, collection coverage) helps educators and TVET learners understand what’s realistic, what systems work, and where interventions matter most.
- For the Global South, inclusive systems that connect formal and informal sectors are often the most effective and equitable.
What we cover in this lesson
- Global generation and recycling rates — a broad, comparative picture and the simple metrics to watch.
- Africa / South Africa / comparable countries — common patterns, typical barriers, and examples of existing systems.
- Key reports and data sources — short, trusted briefs and databases (World Bank, UNEP, FEVE/OECD, national agencies, ISWA) and tips for pulling out the 1‑page facts teachers need.
How to use the lesson
- Focus on three classroom‑friendly metrics: annual glass waste generated (tonnes), post‑consumer glass recycling rate (%), and cullet share in new glass production (%).
- For each country or region you study, collect: generation (t), recycling/recovery rate (%), main collection system (deposit, kerbside, buy‑back), and the role of informal collectors. Those four numbers make a clear 1‑page snapshot.
- Use the “Key reports and data sources” topic to download short briefs (5–30 pages) and extract the figures for handouts or slide cards.
Tone and accessibility
- This lesson is non‑technical and practical — aimed at educators, TVET and senior high learners. Expect short tables, clear definitions, and links to short reports so you can produce crisp one‑page summaries.
Next up: the first topic — Global generation and recycling rates. We’ll define the metrics, show global patterns, and point you to the best short sources for up‑to‑date numbers you can cite.
Lesson Content
0% Complete
0/3 Steps