
-
Why glass matters: history and basics3 Topics
-
Where and how glass is used today3 Topics
-
State of glass waste and recycling3 Topics
-
Collection systems and actors3 Topics
-
Sorting, processing and making cullet3 Topics
-
Remelting, quality and markets3 Topics
-
Environmental, economic and policy aspects3 Topics
-
Practical implementation and teaching resources3 Topics
Participants 9


Monitoring, evaluation and 1‑page summaries

travellingteacher256 April 13, 2026
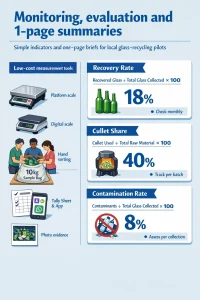
Casual, practical guidance for educators and trainers running local glass‑recycling pilots or lessons. This topic shows which simple indicators to track, how to measure them without fancy kit, how to estimate energy savings, and how to turn results into clear 1‑page briefs for learners, communities and decision‑makers.
Quick overview: why monitor?
Monitoring helps you:
- Know if your collection system is working (are people bringing glass?).
- See if the glass you collect is usable (low contamination = higher value).
- Estimate practical benefits (energy saved, landfill diversion, incomes).
- Produce short, persuasive summaries for learners, funders and local officials.
Keep it simple, repeatable and useful — not a heavy survey for its own sake.
Core indicators (simple, essential)
Use these four core indicators in every pilot or classroom project.
- Recovery rate (per cent)
- What it measures: Share of glass placed on the market that’s recovered for recycling.
- Formula: Recovery rate (%) = (Mass of glass collected for recycling ÷ Mass of glass placed on market) × 100
- Data needed: Collected mass (kg or tonne) + estimate of mass on market (sales records, local producer data, or approximate based on bottles sold).
- Frequency: Monthly or quarterly.
- Practical target examples: Pilot target 30–50%; longer term system target 60–80% (context dependent).
- Cullet share (per cent)
- What it measures: How much recycled glass (cullet) is used in the furnace or reprocessing batch.
- Formula: Cullet share (%) = (Mass of cullet used in batch ÷ Total batch mass) × 100
- Data needed: Weight of cullet added to furnace (or blender) and total batch weight.
- Frequency: Per production run or daily.
- Why it matters: Higher cullet share → lower energy use and lower costs.
- Contamination rate (per cent)
- What it measures: Proportion of collected weight that is non‑glass or unacceptable (ceramics, stones, organics, other waste).
- Formula: Contamination rate (%) = (Mass of contaminants ÷ Total collected mass) × 100
- Data needed: Sorting weigh‑outs at the collection point or at the MRF (manual sorting).
- Frequency: Every collection round (or weekly composite).
- Practical targets: Aim for <5–10% in a functioning system; higher for informal collection until quality improves.
- Energy‑saved estimate (simple)
- What it measures: Rough estimate of fossil energy (or electricity/fuel) saved by using cullet instead of virgin raw materials.
- Formula (simple method):
- Step A — Get baseline energy per tonne for virgin glass (E0, e.g., in GJ/tonne or kWh/tonne). Ask a local furnace operator or use a literature value.
- Step B — Estimate % energy reduction per % cullet. A commonly used rule: every 10% increase in cullet reduces energy by ~2–3% (use local data if you have it). Using 100% cullet can reduce energy by up to ~20–30% in practice.
- Saved energy per tonne = E0 × (Energy reduction factor due to cullet share)
- For your total saved energy = Saved energy per tonne × tonnes of cullet used
- Frequency: Monthly or per batch.
- Note: Use ranges and state assumptions. If you want GHG avoided, multiply energy saved by appropriate emissions factors for your electricity or fuel mix.
Practical measurement methods (low cost)
Data collection should fit classroom and community settings.
- Scales: Use a platform scale at collection point or weighbridge access at a transfer station. For pilots, small digital scales (0–50 kg) are fine for household or school collection drives.
- Tally sheets: Paper form or simple Excel/Google Sheet to record collection date, collector name, weight, contamination notes.
- Sampling for contamination: From each collection load, take a 10 kg sub‑sample, manually sort into glass vs contaminants, weigh and record. This gives contamination rate without sorting entire load.
- Cullet share: Work with the reprocessor or furnace operator to record how much cullet they accept per batch. If you don’t have access, estimate using the weight of cullet supplied by your project vs total batch size reported by the plant.
- Counting vs weighing: For classroom activities, count bottles and convert to weight using an average weight (e.g., 330 ml bottle ≈ 200 g). Always note assumptions.
- Mobile tools: Simple forms via Google Forms, KoBoToolbox or WhatsApp voice/photo reporting from collectors. Photos of loads can help verify quality.
- Involving the informal sector: Include informal collectors in data collection—pay per verified kg, provide cards or tokens that record weight and date, and train them to use tally forms and sorting protocols.
Data quality tips
- Record units (kg/tonne) and stick to them.
- Keep a short log of assumptions (e.g., average bottle mass is 0.2 kg).
- Use consistent sampling method for contamination each time.
- Cross‑check weights at transfer points (compare collector receipts with transfer station scale tickets).
- Make data visible: a simple dashboard on a classroom board or wall chart improves engagement and transparency.
Calculating energy and GHG savings — worked example
Use ranges and show assumptions. Replace the example numbers with local values when available.
Assumptions (example)
- Baseline energy for virgin glass E0 = 3.0 GJ/tonne (≈ 833 kWh/tonne).
- Local estimate: each 10% cullet increase reduces energy by 2.5% (mid‑range).
- Your project supplied 5 tonnes of cullet and it was used at 40% cullet share.
Step 1 — Energy reduction due to cullet share:
- Cullet share 40% → energy reduction = (40 / 10) × 2.5% = 10%
Step 2 — Energy saved per tonne: - Saved energy per tonne = E0 × 10% = 3.0 GJ × 0.10 = 0.30 GJ/tonne
Step 3 — Total energy saved: - Total saved = 0.30 GJ/tonne × 5 tonnes = 1.5 GJ
Step 4 — Convert to kWh (if needed): 1 GJ ≈ 277.78 kWh → 1.5 GJ ≈ 417 kWh
Step 5 — Estimate CO2e avoided (if you have emissions factor) - If local grid emission factor = 0.9 kgCO2e/kWh → avoided = 417 kWh × 0.9 kgCO2e/kWh ≈ 375 kgCO2e
Always report assumptions (E0, reduction per 10% cullet, emission factor) and present results as ranges where uncertain.
Inclusive indicators to add
To make monitoring relevant to Global South contexts, track some socio‑economic indicators:
- Number of informal collectors engaged and paid (gender disaggregated).
- Average income per collector from glass (ZAR or local currency).
- Number of youth/learners trained.
- Local jobs supported at collection, sorting and reprocessing.
- Accessibility: % of households with a nearby collection point (distance or travel time).
These help show social co‑benefits beyond just tonnes.
How to use monitoring results in teaching
- Classroom activity: give learners a 10 kg sample to sort and compute contamination rate; then calculate potential energy saved if that cullet went to a furnace.
- Community reporting: post monthly “dashboard” on noticeboards showing recovery rate, contamination and key wins.
- Role play: students act as collectors, sorters, reprocessor, and decision‑maker using the data to make a pitch for a deposit‑return scheme.
Making a 1‑page non‑technical brief: templates and examples
Aim: one page, clear, visual, targeted. Two quick templates below — one for learners/community and one for decision‑makers. Both are copy‑and‑paste friendly.
Template A — Learner / Community Brief (layout suggestion)
- Header: Project name + logo + date
- One‑line summary: What we did and the main result (big, bold)
- Why it matters (2–3 short bullets)
- Key numbers (icons + big font): tonnes collected; recovery rate; contamination rate; energy saved (kWh or GJ); jobs supported
- Short explanation (2–3 sentences): how we measured and assumptions
- What we learned / next steps (3 bullets)
- Contact / how to help (phone, email, meeting time)
- Small footer: note on assumptions and source of energy calculations
Sample (filled example)
- Header: “GlassBack School Pilot — April 2026”
- One‑line summary: “We collected 1.2 tonnes of glass — enough to save ≈160 kWh of energy and keep 1.2 tonnes out of landfill!”
- Why it matters:
- Less energy needed to make new glass
- Cleaner streets and extra income for 3 local collectors
- Key numbers:
- Collected: 1.2 tonnes
- Recovery rate: 18% (school catchment)
- Contamination: 8% (mostly ceramics)
- Energy saved: ≈160 kWh (assumes 3.0 GJ/tonne baseline)
- How we measured: weighed at school scale; 10 kg samples sorted for contamination; energy estimate uses literature baseline (see footer)
- Next steps: reduce contamination with separate ceramic bin; run community collection day; train 5 more collectors
- Contact: Thandi (072‑xxx‑xxxx) — join our next collection day!
Template B — Decision‑maker / Funders Brief (layout suggestion)
- Header: Project, location, month/year
- One‑line impact summary (big)
- Top metrics row (four boxes): tonnes diverted; recovery rate; contamination rate; estimated energy/GHG avoided
- Short context (1 paragraph): why this matters locally
- Cost & benefits (bullet): basic cost per tonne collected, income to collectors, operational notes
- Evidence & method (short): how data were collected, sampling frequency, main assumptions
- Recommended action (3 bullets): what you want decision‑maker to do (e.g., fund more bins, support buy‑back points, pilot deposit scheme)
- Contact and quick annex reference (where full data are stored)
Sample (filled example)
- Header: “Municipal Pilot — Glass Recovery, Region X — Q1 2026”
- One‑line impact: “Pilot diverted 4.5 tonnes of glass (approx. 12% recovery) and avoided ≈1.35 GJ of furnace energy.”
- Top metrics:
- Diverted: 4.5 t
- Recovery: 12% (from baseline estimate of market flow)
- Contamination: 15% (needs improvement)
- Energy saved: ~1.35 GJ (~375 kWh)
- Context: Low recovery is primarily due to limited collection points; informal collectors supplied 60% of material.
- Cost & benefits:
- Collection cost: ZAR 600 / tonne (pilot)
- Income to collectors: ZAR 1200/month average
- Evidence & method: Weighed at transfer station; contamination from 10 kg weekly samples; energy assumption E0 = 3.0 GJ/tonne; 2.5% energy saving per 10% cullet.
- Recommended action:
- Add three community collection points in high‑density areas.
- Fund sorting training and small incentives to reduce contamination to <10%.
- Explore a bottle deposit‑return scheme feasibility study.
- Contact: Project lead (email) — full data annex available on request.
Design tips for both briefs
- Use big numbers and icons — non‑technical readers glance, they don’t read pages.
- One graph: a simple bar or trend line (monthly tonnes collected) helps show change.
- State assumptions in a tiny footer — transparent and builds trust.
- If printed, keep to one A4; for screens, export as PDF and make clickable contacts.
One‑page checklist for running M&E in a small pilot
- Decide your core indicators (recovery rate, cullet share, contamination, energy saved).
- Choose measurement tools (scale, tally sheet, sample bag).
- Assign roles: who weighs, who sorts, who enters data.
- Decide frequency (weekly collections; monthly reporting).
- Use simple templates (paper or Google Sheet).
- Share results visibly in community/classroom each month.
- Produce a 1‑page brief each quarter for stakeholders.
Final tips
- Be explicit about assumptions — energy and GHG calculations vary a lot by furnace and fuel.
- Keep the community involved in data collection — it builds ownership and improves data quality.
- Use simple visuals and a single clear message on 1‑page briefs — “What we did” + “Why it matters” + “One simple ask”.
- Iterate. Start with simple measures, improve sampling and methods as capacity grows.
If you want, I can:
- Create ready‑to‑print 1‑page templates (learner and decision‑maker) in A4 layout text you can paste into a design tool.
- Draft sample text for your local context (South Africa/Uganda) if you provide one set of local inputs (e.g., baseline energy, average bottle weight, pilot collection totals).