
-
Why glass matters: history and basics3 Topics
-
Where and how glass is used today3 Topics
-
State of glass waste and recycling3 Topics
-
Collection systems and actors3 Topics
-
Sorting, processing and making cullet3 Topics
-
Remelting, quality and markets3 Topics
-
Environmental, economic and policy aspects3 Topics
-
Practical implementation and teaching resources3 Topics
Participants 9


Classroom and field activities

travellingteacher256 April 13, 2026
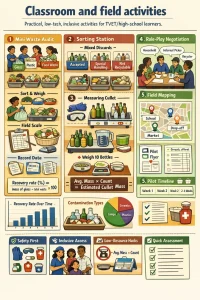
Quick overview
- These activities are designed for TVET/high‑school learners and educators teaching practical, system‑level glass recycling.
- Hands‑on, low‑tech, inclusive and adaptable for classrooms, schoolyards, markets or community centres.
- Each activity includes learning outcomes, materials, step‑by‑step instructions, safety notes, simple assessment ideas and low‑resource adaptations.
Learning outcomes (pick 3–5 to match your lesson time)
- Understand what a “recovery rate” and “cullet share” are, and how to measure them.
- Be able to sort glass by type and identify contaminants that reduce recyclability.
- Collect simple field data (mass, count, contamination %) and interpret it in plain language.
- Experience systems thinking: how households, collectors, sorters and recyclers interact.
- Design a small pilot or awareness activity for a community, including inclusive engagement of informal workers.
Materials (basic)
- Kitchen/field scale (0–5 kg) or balance; measuring jug or water bottle for volume checks
- Cardboard trays or buckets for sorting
- Gloves (leather or heavy work), goggles (if cutting/breaking glass), sturdy rubbish bags
- Permanent marker, masking tape, labels
- Clipboards, pens, simple data sheets (see templates below)
- Camera or phone (optional) for mapping and photos
- Basic first‑aid kit
Activity 1 — Mini waste audit: measure school/market recovery rate
Purpose: measure how much glass ends up in the waste stream, and how much is collected for recycling.
Time: 60–120 minutes (could be across 24 hrs if auditing daily waste)
Group size: 3–6 per team
Steps
-
Select a sample area or source: school canteen for one day, a single classroom, or a market stall. Define the audit period (e.g., one school day).
-
Collect all waste for the period in labelled bags (separate glass if possible).
-
In a safe area, sort the waste into categories: glass containers, plastics, paper, organics, other. Place glass items in a tray.
-
Count glass items and weigh the glass (or a sample). If you can’t weigh every item, weigh a representative sample (e.g., 10 bottles) to get average mass.
-
Record total mass of waste and mass of glass. Calculate recovery rate:
Recovery rate (%) = (mass of glass collected for recycling ÷ mass of total waste generated in audit) × 100
Note: this is a simple site‑level recovery rate. If you want community recovery rate, you need estimates of total glass generated vs. collected.
-
Discuss results: contamination (caps, labels, food), opportunities to separate glass at source, and likely destination of collected glass.
Safety
- Wear gloves when handling broken glass. Sweep up small shards carefully into a puncture‑proof container.
Low‑resource adaptation
- If no scale: count items and use an average mass (measure a few bottles first, or use locally known average). Or express results as number of bottles per day instead of mass.
Activity 2 — Sorting exercise: identifying recyclable vs non‑recyclable glass
Purpose: teach types of glass and contamination that breaks recycling streams.
Time: 30–45 minutes
Group size: 4–8
Materials
- A mixed tray of items: clear/green/brown bottles, glass jars, light bulbs, drinking glasses, window glass shards, ceramics, glass with glued labels, metal lids.
Steps
- Learners sort items into piles: “Accepted by container glass recycler”, “Needs special handling (lamps/window)”, “Not recyclable here”.
- For each pile, discuss why an item is accepted or rejected (contamination, composition, melting point, coatings).
- Optional: test simple separation — remove lids and rinse bottles; time the students and discuss labour required.
Key teaching points
- Container glass recyclers usually accept bottles and jars of similar chemical composition. Flat glass (windows), ceramics, light bulbs and heat‑resistant glass are often incompatible.
- Contaminants (food residue, plastic labels, metal caps) create costs and lower value.
Activity 3 — Mass and volume measurements: how to estimate cullet quantity
Purpose: teach basic measurement and scaling to estimate cullet (waste glass) available from a stream.
Time: 30–60 minutes
Group size: 2–4
Steps
- Measure and record the empty mass of 10 typical bottles/jars from your collection to get an average mass per item.
- Count total number of bottles collected in a day (or week).
- Estimate total cullet mass = average mass × count.
- Optional: measure bottle capacity with water to connect glass mass to container size.
Example (hypothetical)
- Average empty bottle mass = 300 g (0.3 kg)
- Bottles counted = 120
- Estimated cullet mass = 0.3 kg × 120 = 36 kg
Note: bottle masses vary widely (small beer bottles ≈ 180–250 g; large wine bottles ≈ 400–700 g). Always measure local samples for accuracy.
Activity 4 — Role‑play: the glass recycling system
Purpose: practice systems thinking, perspectives and negotiation among stakeholders.
Time: 40–60 minutes
Group size: 10–20 (teams of 3–4 per role)
Roles
- Household/consumer
- Informal waste picker/collector
- Formal municipal collection official
- Small collector/broker
- Sorting yard manager
- Glass furnace/recycler owner
- Retailer (packaging supplier)
- Community leader/NGO
Steps
- Give each team a role card describing objectives, constraints and priorities (e.g., informal picker’s income depends on sold bottles; recycler needs low‑contamination cullet).
- Pose a scenario: municipality plans a new collection point but lacks budget for transport; informal pickers fear loss of income.
- Teams negotiate outcomes: agree on collection logistics, pricing for cullet, inclusion measures for informal workers, education plan.
- Debrief: discuss trade‑offs, equity, where leakage occurs (why glass ends up in landfill), and practical steps that improve recovery.
Learning focus
- Power dynamics, incentives, simple economics (who pays, who benefits), and the practicalities that make a recycling system work or fail.
Activity 5 — Field mapping and pilot design
Purpose: design a small, local pilot (bottle bank, drop‑off point, or school collection) and plan monitoring.
Time: 1–2 hours for mapping + follow‑up pilot over weeks
Group size: 3–6
Steps
- Map potential collection sites: schools, shops, taxi ranks, markets, residential blocks.
- For each site, note foot traffic, available space, security, and proximity to transport/recycler.
- Select a pilot site and sketch a simple logistics plan: who will collect, when, and where the glass will be sent.
- Prepare a one‑page community flyer explaining the pilot (purpose, what to put in the bank, inclusivity commitments — e.g., “informal pickers welcome to collect from here”).
- Run the pilot for 2–4 weeks, using the monitoring sheet below.
Simple monitoring/data sheet (printable)
- Date
- Location/site
- Collector name
- Number of containers collected (count)
- Approx. mass collected (kg) or method used (e.g., average mass × count)
- Contamination notes (food residue %, lids present %, wrong glass types)
- Destination (broker/recycler/landfill)
- Payment or revenue (if any)
- Photos or comments
How to calculate simple metrics
- Site recovery rate (%) = (mass of glass collected at site ÷ mass of all waste generated at site in audit period) × 100
- Cullet share (%) = (mass of cullet used in production ÷ total mass of glass used in production) × 100 — for classroom use you can simulate this using a furnace/oven demo or a calculator activity
- Contamination rate (%) = (mass of non‑acceptable materials in glass load ÷ total glass load mass) × 100
Classroom example calculation (hypothetical)
- School waste for one day = 150 kg
- Glass collected separately = 12 kg
- Recovery rate = (12 ÷ 150) × 100 = 8%
Assessment ideas
- Practical checklist: correctly sorted a mixed bag, measured and recorded data, calculated recovery rate.
- Short reflection: what were the main barriers to collecting clean cullet? What would improve recovery?
- Present pilot plan to class or community members as a 5‑minute pitch.
Inclusive practice — involving the informal sector and marginalised groups
- Invite local waste pickers as co‑trainers or paid consultants — they have invaluable practical knowledge.
- Ensure meeting times and collection points are accessible (ramps, level ground); provide translated materials if needed.
- Offer small stipends or food for participants from low‑income groups when running pilots.
- Make roles suitable for learners with disabilities (e.g., supervising, data entry, mapping rather than heavy lifting).
Safety and ethical notes
- Never ask learners to handle sharp, very heavy or heated materials without training and protective equipment.
- Respect privacy and livelihoods of informal workers; obtain consent before taking photos or publishing data.
- Dispose of broken glass into a puncture‑proof container and follow local waste regulations.
Low‑resource hacks
- No scale? Use a fixed number of bottles × measured average mass.
- No gloves? Use thick plastic bags doubled up or tongs for picking up glass (not ideal — aim to get gloves).
- No paper forms? Use a whiteboard or WhatsApp group for daily logs and photos.
One‑page learner summary template (for printing)
- Title: What we measured today
- What we did (1–2 lines)
- Key numbers: total waste (kg), glass collected (kg), recovery rate (%)
- Main contaminants found
- Top 3 things we can do to improve recovery in our community
- Who to contact / local partners (space for teacher to fill in)
Suggested follow‑up classroom tasks
- Weekly tracking chart: see if recovery improves after an awareness campaign.
- Small research task: contact a local recycling business and ask what they need (clean cullet? colour separation?)
- Maths connection: graph recovery rate over time; compute percentage change.
Final tips for educators
- Emphasise local measurement: many averages from literature don’t match local bottles and habits.
- Keep language non‑technical: focus on “what to do” and “why it matters” rather than chemistry.
- Use real stakeholders whenever possible; a short visit from a local collector or recycler makes lessons come alive.
- Always debrief: hands‑on activities are richer if learners reflect on systems, equity and practical next steps.
If you’d like, I can:
- Draft printable monitoring sheets and a one‑page learner handout for your specific context (South Africa/Uganda style),
- Create role cards for the role‑play with realistic local constraints, or
- Produce a short script for a 10‑minute pilot community announcement. Which would help most?