
-
Why glass matters: history and basics3 Topics
-
Where and how glass is used today3 Topics
-
State of glass waste and recycling3 Topics
-
Collection systems and actors3 Topics
-
Sorting, processing and making cullet3 Topics
-
Remelting, quality and markets3 Topics
-
Environmental, economic and policy aspects3 Topics
-
Practical implementation and teaching resources3 Topics
Participants 9


Economics, jobs and livelihoods

travellingteacher256 April 13, 2026
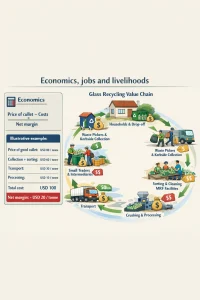
This topic explains how glass recycling actually makes (and saves) money, who works in the value chain, and why improving recovery rates is an economic win — especially in Global South contexts where formal systems and informal livelihoods co-exist. The tone is practical and non‑technical so you can use this directly with educators or TVET learners.
Quick overview
- Glass is a valuable material: clean cullet (broken glass sorted by colour) is a feedstock for new glass, replacing virgin raw materials and cutting furnace energy needs. That creates direct cost savings for glass makers.
- Recycling activities (collection, sorting, transport, processing) generate local jobs — both formal (MRFs, remelt plants, transport) and informal (waste pickers, small collectors). In many Global South cities these livelihoods are a substantial local economy.
- Improving recovery rates usually reduces net system costs (energy, raw materials, landfill/tipping fees) and can increase local employment — if policies are designed to be inclusive.
Cost and revenue basics — the simple economics
Key income sources and costs in a local glass recycling chain:
-
Revenues
- Sale of cullet (usually priced per tonne or per kg; prices vary by quality, colour and local demand).
- Fees paid under producer responsibility schemes or municipal contracts (e.g. collection contracts, service fees).
- Deposit‑refund receipts (where a deposit‑return scheme exists).
- Material recovery credits where markets pay for sorted cullet.
-
Costs
- Collection (household/kerbside, drop‑off centres, itinerant collectors).
- Sorting and cleaning (labour, screening, removal of contaminants).
- Transport (glass is heavy; distance to remelt plant matters).
- Processing (crushing, screening, storage; sometimes pay for washing).
- Transaction costs / middlemen margins (especially where informal collectors sell to intermediaries).
- Contamination penalties (low‑quality cullet can be rejected by remelters).
Simple unit economics (illustrative only — local figures vary a lot):
- Price of good cullet: often low compared with value of final glass product — e.g., US$20–100/tonne in some markets (very variable).
- Cost of collection + sorting per tonne: can be US$50–200/tonne depending on scale and transport distance.
- Net margin for a recycler depends on local remelt demand and logistics; in many places margins are small — so scale and steady supply matter.
A simple calculator (put in local numbers):
- Revenue per tonne = price_cullet
- Costs per tonne = collection_cost + sorting_cost + transport_cost + processing_cost
- Net margin per tonne = Revenue − Costs
If Net margin < 0, the private market needs subsidies, EPR payments, DRS income or municipal support to keep the chain viable.
Short worked example (illustrative)
Assume:
- Price of good cullet = USD 80 / tonne
- Collection + sorting = USD 60 / tonne
- Transport = USD 30 / tonne
- Processing = USD 10 / tonne
Total cost = 100 → Net margin = −USD 20 / tonne (loss)
What this shows:
- At those numbers the market on its own fails. Policy tools (deposit schemes, EPR payments, municipal contracts, higher material prices through guaranteed offtake) can bridge the gap.
- Reduce transport distances (local remelt), improve sorting (higher price), or raise collection efficiency to make it viable.
How recycling creates jobs — formal and informal sectors
Types of jobs along the glass recycling value chain
-
Informal sector
- Waste pickers / street collectors: collect bottles from bins, streets, dumpsites and households.
- Small traders / intermediaries: buy from pickers, aggregate loads for buyers.
- Scrap yards and small sorting stalls.
-
Formal sector
- Kerbside collection crews and drivers.
- Material recovery facility (MRF) operators and sorters.
- Transport/logistics drivers and loaders.
- Cullet processors (crushers, screens) and maintenance staff.
- Remelt plant workers (batching, furnace operators, quality control).
- Administrative, sales and compliance roles (especially under producer responsibility schemes).
Job quality and pay
- Informal jobs are often low paid, insecure and lacking social protections, but they provide essential income and low entry barriers.
- Formal recycling jobs tend to pay more and offer steadier hours and protections; upgrading requires investment in training, equipment and organisation.
Evidence on job quantities and multipliers (how many jobs per tonne)
- Recycling activities typically create more jobs per tonne than landfilling or incineration because of labour intensity (collection and sorting).
- Exact multipliers vary by country and technology. Studies (including WIEGO briefs and several circular‑economy reports) show sizable local employment potential — important for labour‑rich economies.
- Because data are uneven, use local surveys or pilot projects to estimate jobs per 1,000 tonnes collected in your area.
Inclusive outcomes: integrating the informal sector
- Where waste pickers are recognised, incomes and working conditions can improve while preserving the cost advantages they bring.
- Successful approaches: cooperatives, direct procurement by recyclers, fair pricing, social protections, ID cards and access to PPE and storage.
The economic case for improving recovery rates
Why aim for higher recovery (percent of glass waste collected and used as cullet)?
- Lower manufacturing costs: each tonne of cullet replaces virgin sand/soda ash/limestone and reduces furnace fuel. That cuts energy bills and raw‑material purchases for glass producers.
- Climate and environmental cost savings: reduced fuel use → lower CO2 emissions; avoided landfilling saves local municipal costs and pollution.
- Local economic benefits: more stable supply of cullet supports local remelt plants and MRFs; higher volumes can reduce unit costs (economies of scale), sustain formal jobs and increase local value capture.
- Reduced loss of material value: when glass is landfilled or very contaminated, the material value is lost. Collecting clean cullet retains economic value in the local economy.
Example impacts (directional, based on consolidated industry briefs)
- Energy and emissions: using cullet reduces furnace energy needs and CO2 — the exact savings depend on furnace technology and cullet share. Higher cullet share = bigger savings.
- Unit costs: increasing cullet share usually lowers production cost per tonne for manufacturers; this makes domestic production more competitive vs imported glass or packaging alternatives.
- Fiscal/spillover benefits: reduced landfill volume lowers municipal disposal costs; recycling can lower waste management subsidies.
Caveat: benefits are maximised where cullet is clean, sorted (by colour where required), and delivered reliably to remelters. Contamination or long transport distances can erode the economic case.
Policy and business levers to improve economic outcomes equitably
Practical tools that boost recovery and support livelihoods
- Deposit‑return schemes (DRS): proven to increase collection rates and create predictable incomes for collectors. Design for inclusion (accessible collection points; fair refund amounts).
- Extended Producer Responsibility (EPR): obliges producers/importers to fund collection and recycling — can be used to subsidise logistics and integrate informal workers.
- Municipal contracts and public procurement: local authorities can contract inclusive collectors/cooperatives for collection or buy recycled cullet preferentially.
- Formalisation and co‑ops: help waste pickers form cooperatives, gain bargaining power, training, PPE and access to finance.
- Pay‑for‑service or incentive payments: per‑kg payments at drop‑off points or to cooperatives to raise participation.
- Local remelt capacity development: promote smaller local furnaces or modular plants to reduce transport costs and keep value local.
- Quality standards and training: improve cullet quality to command higher prices from remelters.
Design tips for Global South contexts
- Start with participatory mapping of informal waste actors and markets.
- Use pilots to test pricing and logistics before scaling.
- Keep transport and processing costs in view — glass is heavy, so localisation matters.
- Combine economic incentives with social protection measures (healthcare, IDs, pensions) for waste workers.
Simple metrics to track economic performance (easy to explain in class)
- Recovery rate = (tonnes glass collected for recycling / total glass waste generated) × 100%
- Cullet share = (tonnes cullet used in production / total glass used in production) × 100%
- Energy saving per tonne cullet = estimate from remelter data (or use published ranges for rough classroom examples)
- Jobs per 1,000 tonnes collected = local estimate from surveys or pilot projects
- Unit margin per tonne = price_cullet − cost_per_tonne (gives viability signal)
Use real local numbers where possible; if unavailable, run class exercises with illustrative numbers to build understanding.
Recommended short, practical readings (good for 1‑page synthesis)
These are practical briefs and policy notes useful for educators and learners. I can fetch PDFs or make 1‑page summaries from any of these.
- WIEGO, “Waste Pickers and Recycling” — short briefs on informal recycling, livelihoods and policy integration (10–20 pages). Useful to understand informal sector roles and inclusion strategies.
- World Bank, “What a Waste 2.0” (2018) — broad MSW data and country profiles (longer, but contains concise country summaries). Good for context on waste quantities and urban waste management.
- FEVE (European Container Glass Federation) or Glass for Europe short factsheets — industry briefs on cullet benefits, energy and CO2 savings (4–12 pages). Useful for simple numbers on cullet advantages.
- UNEP / ISWA short policy briefs on municipal recycling and circular solutions — practical recommendations for cities (briefs typically 8–20 pages).
- RREUSE or GAIA policy briefs — inclusive recycling and social enterprise models (5–20 pages).
- National reports (where available): look for South African Department of Environment briefs on waste economy or national recycling strategies; in many countries these are compact and practical.
If you want, I’ll compile 1‑page, non‑technical summaries from 3–5 of these reports tailored to South Africa/Uganda style contexts.
Classroom / educator activity ideas (short)
- Local numbers exercise: ask learners to survey a market or block for bottles over one week; estimate recovery rate using a simple form and calculate potential income for collectors.
- Role‑play negotiation: students role‑play a waste picker, middleman and remelter to learn margins and how prices are set.
- Policy design mini‑task: groups design a simple DRS or co‑op model and present the likely economic impacts and jobs created.
If you want, I can:
- Prepare a 1‑page, non‑technical summary of this topic for learners (ready to paste into course slides).
- Pull 3–5 short reports (PDFs) and produce matching 1‑page briefs for each (sourcing from UNEP, WIEGO, FEVE or national agencies) — tell me which country to prioritise (SA or Uganda), and I’ll tailor the examples and local figures.