
-
Why glass matters: history and basics3 Topics
-
Where and how glass is used today3 Topics
-
State of glass waste and recycling3 Topics
-
Collection systems and actors3 Topics
-
Sorting, processing and making cullet3 Topics
-
Remelting, quality and markets3 Topics
-
Environmental, economic and policy aspects3 Topics
-
Practical implementation and teaching resources3 Topics
Participants 9


Life‑cycle impacts and benefits

travellingteacher256 April 13, 2026
Life‑cycle impacts and benefits
Quick intro
When we talk about the life‑cycle impacts of glass recycling, we’re asking: what environmental benefits do we get when we collect, sort and remelt waste glass (cullet) instead of making new glass from raw materials — and what trade‑offs should we watch for? Below is a non‑technical, practical summary you can use in a classroom or TVET session.
Big picture takeaways
- Using cullet in glass manufacturing reduces the energy needed to melt the batch and cuts greenhouse‑gas emissions.
- The biggest environmental wins come from high cullet shares (the % of recycled glass in the furnace) and local remelting that keeps transport distances short.
- Collection and sorting matter: contamination reduces cullet value and can cancel benefits.
- Even though glass is inert and doesn’t make methane in landfill, avoiding landfill saves space, reduces material loss and lowers emissions from producing new virgin material.
How cullet saves energy and emissions (simple, evidence‑based insights)
- Replacing virgin raw materials with cullet lowers melting energy because cullet is already glass — it melts at lower temperature and more easily. The exact savings depend on furnace type, cullet quality and the electricity/fuel mix used.
- Rule‑of‑thumb numbers commonly used in industry and LCA summaries:
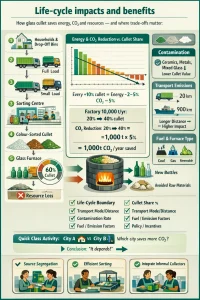
- Every 10 percentage points of cullet in the furnace typically reduces energy use by ~2–3% and CO2 emissions by roughly 5% (ranges vary).
- Using high cullet levels (30–60% and above) can cut production energy and emissions substantially — sometimes by 15–30% or more compared with 0% cullet.
- Why ranges are wide: small, older furnaces, or furnaces fuelled by coal, behave differently from large, efficient electric or gas furnaces running modern control systems. Local electricity emissions intensity matters a lot.
Concrete but simple example for teaching
Use this quick formula to estimate order‑of‑magnitude carbon savings when cullet use increases:
CO2_saved ≈ annual_production_tonnes × (%cullet_increase / 10) × CO2_reduction_per_10%_cullet
Where CO2_reduction_per_10%_cullet can be taken as 0.04–0.06 tonnes CO2 per tonne produced (that is, 4–6% per 10% cullet) for a rough classroom estimate.
Example: a factory making 10 000 t/yr increases cullet share from 20% to 40% (+20 percentage points):
CO2_saved ≈ 10 000 × (20/10) × 0.05 = 10 000 × 2 × 0.05 = 1 000 tCO2/yr (order of magnitude).
Avoided landfilling: benefits beyond CO2
- Glass is chemically inert, so it doesn’t rot or emit methane in landfill. That’s good — but glass in landfill still:
- Occupies space (glass is heavy and bulky), hastening the need for more cells or new sites, and
- Means loss of a fully reusable material (resource depletion).
- Avoiding landfill by recycling conserves raw materials (sand, soda ash, limestone) and avoids the environmental impacts of mining and processing those materials.
- There are local co‑benefits: reduced litter and visual pollution, and in some settings improved safety (less broken glass in public spaces).
Transport and logistics: when they matter
- Transport of waste glass (from households to sorting centres, and from sorter to remelt plant) uses energy and emits CO2. But transport emissions are usually small compared with the energy required to melt virgin raw materials — unless distances are long and road transport is used inefficiently.
- Key trade‑offs:
- Local remelting of cullet is usually best. If cullet must travel very long distances by truck (hundreds of km), transport emissions and costs can erode benefits.
- Shipping cullet by sea is often more carbon‑efficient per tonne‑km than road transport; so cross‑border export to a remelter by sea can be competitive in some cases.
- Backhauling and full truckloads matter: poorly consolidated small loads increase per‑tonne transport emissions. Collection design (drop‑off points, collection routes) can make a big difference.
- Practical classroom point: emphasise “life‑cycle thinking” — don’t assume recycling is always better: look at collection system, distances, transport mode and remelt capacity.
Quality and contamination: the productivity penalty
- Contaminants (ceramics, stones, metals, mixed colours) reduce the usable fraction of cullet and can force remelters to lower cullet shares or add costly sorting. That lowers net environmental gains.
- Colour sorting is important: clear (flint), brown and green glass are often processed separately for high‑quality container production. Mixed‑colour cullet has lower value or is used in lower‑grade products.
- Good practice: invest in source segregation, efficient sorting (manual + mechanical + optical), and public education to raise cullet quality.
Other environmental and social co‑benefits
- Lower furnace energy means fewer local air pollutants (SOx, NOx, particulates) when fossil fuels are displaced. This can improve local air quality near production sites.
- Recycling supports jobs in collection and sorting — in many Global South contexts the informal sector plays a big role. Inclusive systems that recognise and integrate waste pickers preserve livelihoods while improving environmental outcomes.
- Conserving raw materials reduces impacts from quarrying and the related health risks (e.g. silica dust).
Putting it into a checklist for teachers / learners
- Life‑cycle boundary: include collection, sorting, transport, remelting, avoided primary production and avoided disposal.
- Ask these questions when evaluating a recycling option:
- What is the current cullet share and what can be realistically achieved?
- How far must cullet travel to get to a remelter, and by which transport modes?
- What is the contamination rate and colour mix?
- What fuel/electricity is used in melting (coal, gas, electricity) and what are local emission factors?
- Are there local policies/incentives (e.g. deposit schemes, landfill bans) supporting recycling?
- Simple metrics to track: collection (recovery) rate %, cullet share % in furnace, energy use per tonne glass, CO2 per tonne glass (cradle‑to‑gate), tonnes diverted from landfill.
Common misconceptions to clear up
- “Glass recycling always saves a lot of carbon.” Often true, but the magnitude depends on cullet share, furnace efficiency and transport.
- “Glass in landfill is worse because it makes methane.” No — glass is inert and does not generate methane, but landfill still wastes a valuable resource and takes up space.
- “Any collected glass is equally valuable.” Not true — quality (cleanliness, colour, size) matters.
Class activity idea (5–15 minutes)
Give learners two short scenarios and ask which has the better life‑cycle outcome and why:
- City A collects glass and sends it 20 km to a modern remelting plant; cullet quality is high and cullet share is 40%.
- City B collects glass and exports it 900 km by road to a remelter; cullet is 60% contaminated and ends up being used at 10% share.
Discuss transport, contamination, and final cullet share and which scenario gives the larger net benefit.
Where to look for data and further reading (short list)
- Sector fact sheets and summaries by the glass trade / recycling organisations (good for practical figures and case studies). Look for FEVE (European container glass federation) and the Glass Packaging Institute.
- UNEP and World Bank municipal waste reports for country/regional waste composition and tonnages (useful for estimating glass shares in MSW).
- Recent review papers and policy briefs on circular economy and packaging recycling — use these for consolidated LCA ranges and methodology notes.
(When preparing handouts, pick 1–3 short briefs (5–30 pages) that summarise LCA findings so learners aren’t overwhelmed by technical detail.)
Final classroom message (short and punchy)
Recycling glass by remelting cullet usually gives clear energy and carbon benefits, saves raw materials and keeps glass out of landfill — but the real gains come from good systems: clean collection, smart sorting, short transport routes and fair inclusion of informal collectors. Life‑cycle thinking helps you spot where the benefits are biggest and where trade‑offs might cancel them out.
If you want, I can draft a 1‑page educator handout (non‑technical) with the key numbers, the checklist and the short class activity ready to print.