
-
Why glass matters: history and basics3 Topics
-
Where and how glass is used today3 Topics
-
State of glass waste and recycling3 Topics
-
Collection systems and actors3 Topics
-
Sorting, processing and making cullet3 Topics
-
Remelting, quality and markets3 Topics
-
Environmental, economic and policy aspects3 Topics
-
Practical implementation and teaching resources3 Topics
Participants 9


End markets and value chains

travellingteacher256 April 13, 2026
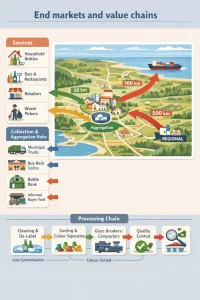
This topic looks at who actually buys cullet (waste glass), where those buyers are, what stops those markets working well in the Global South, and practical strategies to grow demand so more glass gets remelted into new products.
I’ll keep things simple and practical — the kind of material you can use in a classroom, TVET workshop or community training.
A simple map of cullet end markets (local → regional)
Think of cullet flowing along a few main paths. The closer the remelter or user is to the source, the cheaper and more viable the market — glass is heavy and bulky, so distance matters.
- Source: households, bars, restaurants, retailers, informal collectors
- Collection & aggregation: municipal collection, buy‑back centres, bottle banks, informal buyer yards, deposit‑return system (if present)
- Primary processors: cleaning & sorting facilities, glass breakers/compactors, colour separation units
- End markets (local and regional)
- Container glass manufacturers (bottles & jars) — highest value if cullet is clean and colour‑sorted
- Other glass manufacturers (limited): fibreglass, glass wool, certain glassware (requires specific chemistry)
- Flat glass / architectural glass — possible but requires strict chemistry and low contamination
- Secondary/industrial uses: crushed glass aggregate for road base, sand replacement in construction, tiles, abrasives
- Export markets: neighbouring countries or regional remelters where local demand is low
- Closing the loop: remelters supply manufacturers who make new containers or other products — ideally sold back to local retailers
Simple flow diagram (text form):
Source → Collection → Sorting/Processing → Remelter or Secondary User → Manufacturer → Market (local/regional/export)
Who pays more — and why? Colour, contamination and consistency
Value of cullet depends mainly on:
- Colour: flint (clear) is most valuable, then amber/brown, then green. Mixed colour is less desirable for container remelt but OK for some secondary uses.
- Contamination: ceramics, metals, stones, organics and labelled caps cause defects in furnaces. Low contamination = higher price.
- Particle size & preparation: whole bottles vs crushed — compacted/cleaned cullet costs less to transport and handle, but too fine dust may be problematic.
- Consistency & reliability of supply: manufacturers prefer predictable monthly tonnes.
Typical buyer preference:
- Bottle makers prefer well‑sorted, low‑contamination cullet (same colour).
- Fibre/insulation producers can accept mixed colour and slightly higher contamination.
- Civil/construction uses accept mixed colour and lower quality.
Price is negotiated per tonne and must cover collection + sorting + transport. Because glass is heavy, transport distance eats profit quickly.
Key constraints to market development in the Global South
- Supply inconsistency
- Low or irregular collection rates; seasonal spikes; informal stream interruptions
- Poor quality
- High contamination (ceramics, stones, organics, metal), mixed colours, broken into unsuitable sizes
- Transport costs
- Glass is heavy and low value‑density; long distances make cullet uneconomic
- Lack of standards and market information
- No clear cullet quality specs or reliable price information for buyers/sellers
- Limited local demand
- Few nearby remelters or glass manufacturers; many countries import virgin raw materials instead
- Policy gaps
- No deposit‑return systems, weak extended producer responsibility (EPR), or no mandates for recycled content
- Exclusion of informal sector
- Collectors/ waste pickers often unpaid or undercut, making supply unstable and inefficient
- Technical incompatibility
- Old furnaces or production processes may not accept high cullet shares, or require specific chemistry
- Financial barriers
- SMEs lack capital for sorting equipment, compactors, transport or quality control systems
Practical strategies to increase demand for recycled glass
These are practical, low‑technical measures you can teach or pilot locally.
-
Improve quality at source
- Simple behaviour-change: rinse bottles, remove lids & caps, separate by colour where feasible.
- Train collectors to remove contaminants and segregate colours.
- Use community sorting stations or small cooperative buy‑back centres.
-
Aggregate supply into hubs
- Set up local aggregation points near collection catchments to create bulk, predictable deliveries to remelters.
- Hubs can provide basic processing (de‑label, metal removal, coarse sorting) to raise value.
-
Reduce transport costs
- Use compactors/crushers locally to reduce volume (and therefore transport cost).
- Match catchment areas to remelters within economical distance — map road distances and volumes.
-
Build demand through procurement & policy
- Municipal procurement of products that use recycled glass (e.g., tiles, pavers).
- Encourage national/regional targets or incentives for recycled content in container manufacturing.
- Promote Deposit‑Return Schemes (DRS) or EPR to increase collection volumes and lower contamination.
-
Engage the informal sector fairly
- Recognise waste pickers as suppliers: organise them into cooperatives, give training, provide PPE, and pay fair prices.
- Use simple digital tools (SMS, WhatsApp) to coordinate collections and payments.
-
Offer technical support to remelters
- Help local furnaces accept higher cullet blends by sharing best practice: pre‑treatment, careful batch control, and small pilot trials.
- Connect manufacturers with suppliers to test gradually increasing cullet share (e.g., start at 10–20%, monitor defects).
-
Create clear cullet specifications
- Develop locally appropriate spec sheets (max contamination %, acceptable colours, packaging requirements).
- Publicise prices for different quality bands so collectors know what raises value.
-
Product diversification
- Where container remelt demand is limited, develop secondary products: glass aggregate for roads, tiles, sand substitutes for construction, decorative products.
- These markets tolerate lower‑quality cullet and can absorb mixed colours.
-
Financial and market incentives
- Small grants or micro‑finance for sorting equipment, compactors, transport.
- Temporary tax breaks or rebates for manufacturers that increase cullet share.
-
Market linkages and transparency
- Build local directories of buyers and sellers.
- Use mobile or online platforms to match supply and demand and publish current prices.
How quality influences value and closed‑loop outcomes (short summary)
- Cleaner, colour‑sorted cullet → higher price → higher substitution rates in furnaces → more energy and emissions savings → stronger closed loop.
- Mixed, contaminated cullet → low or niche demand → often diverted to low‑value uses or landfill → closed loop weak or broken.
So improving basic quality is the fastest way to grow markets and achieve environmental benefits.
Simple metrics to monitor end‑market health
(Handy for classroom exercises and local projects)
- Recovery rate: % of glass placed on market that is collected for recycling
- Cullet share: % cullet used in furnace feed (by weight)
- Contamination rate: % by weight of foreign material in sorted cullet
- Price per tonne for different quality bands (clear/amber/green/mixed)
- Average distance from aggregation hub to remelter (km)
- Number of stable buyers (≥3 months of continuous purchases)
- Volume stability: tonnes/month supplied vs demanded
Use these to set targets (e.g., raise recovery by 10% in 12 months; reduce contamination to <2% etc.).
Classroom / TVET activity ideas (practical, low cost)
- Market mapping exercise: students map local sources of glass, potential buyers (bottleworks, breweries, construction firms), routes and transport costs. Identify the sweet spot radius for economically viable supply.
- Quality scoring game: present samples of cullet (photos or real) and score contamination, colour, and likely value. Discuss how price might change.
- Role play negotiation: students role‑play collectors, aggregation hub managers and factory buyers to negotiate a contract price and quality terms.
- Mini pilot: run a week‑long collection drive, record volumes, contamination and link to a buyer. Calculate transport cost per tonne and potential revenue.
Where to look for short, reliable reports
(Useful for lesson handouts and further reading)
- UNEP briefs on circular economy and waste management
- World Bank / “What a Waste” series for waste generation and collection context
- Regional development bank reports (African Development Bank) on solid waste and recycling
- National environment or industry associations (glass or recycling federations) for country‑level cullet specs and market data
- Short academic or policy reviews that summarise recycling systems and economics (look for review papers and policy briefs rather than lab studies)
When selecting a report, prefer 5–30 page briefs or policy notes that summarise data and provide actionable recommendations.
If you want, I can:
- Draft a one‑page teacher handout that summarises the map, constraints and top 6 strategies.
- Create a simple worksheet for the market mapping classroom activity tailored to South African or Ugandan contexts.