
-
Why glass matters: history and basics3 Topics
-
Where and how glass is used today3 Topics
-
State of glass waste and recycling3 Topics
-
Collection systems and actors3 Topics
-
Sorting, processing and making cullet3 Topics
-
Remelting, quality and markets3 Topics
-
Environmental, economic and policy aspects3 Topics
-
Practical implementation and teaching resources3 Topics
Participants 9


Design choices and simple metrics

travellingteacher256 April 13, 2026
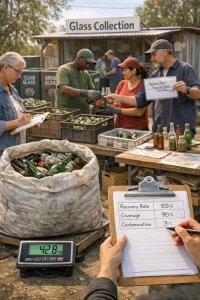
This topic looks at how your choices when setting up a glass collection system affect performance — and how to measure that performance simply and reliably. The focus is practical: a few clear metrics you can collect in small pilots, what they tell you, and low‑cost ways to collect the data.
Tone: casual, practical and evidence‑based. Imagine you’re training teachers, TVET learners or community co‑ops — nothing too technical, just useful numbers and steps.
Quick overview: what to measure and why
- Recovery rate — measures how much of the available waste glass you actually collect for recycling. It tells you system effectiveness.
- Cullet share — measures how much recycled glass ends up back in production. It links collection to manufacturing demand.
- Collection coverage — measures who you reach (households, businesses, area). It hints at equity and scalability.
- Quality indicators — basic measures of contamination and breakage that affect whether cullet is usable.
These metrics are simple but powerful. Together they show whether a system is collecting enough glass, of good enough quality, and whether industry can use it.
Definitions, formulas and worked examples
- Recovery rate (for a pilot area)
- Formula: Recovery rate (%) = (mass of glass collected for recycling ÷ estimated mass of glass waste generated) × 100
- Notes: “Glass collected” = cleaned, segregated glass delivered to recycler (cullet). “Estimated waste generated” can be from waste composition studies, local averages, or household surveys.
- Example: In a small township, you collected 2 000 kg of glass in one month. Local estimates say households there generate 6 000 kg glass/month. Recovery rate = (2 000 ÷ 6 000) × 100 = 33%.
- Cullet share (at a glass processor/factory)
- Formula: Cullet share (%) = (mass of cullet used ÷ total glass feedstock used in production) × 100
- Notes: Factory records usually give this directly. Higher cullet share = less virgin raw materials and energy.
- Example: A bottling plant used 30 tonnes of cullet and 70 tonnes of virgin material in a month. Cullet share = (30 ÷ 100) × 100 = 30%.
- Collection coverage
- Formula (household coverage): Coverage (%) = (number of households served ÷ total households in target area) × 100
- Example: You service 1 200 households in a ward of 2 000 households. Coverage = (1 200 ÷ 2 000) × 100 = 60%.
- Quality indicators (simple measures)
- Contamination rate (%) = (mass of non‑glass or unusable material in collected load ÷ total mass of collected load) × 100
- Breakage or fines (%) = proportion of glass so broken/fragmented it’s not usable for container glass (measured by mass or visual estimate).
- Example: A batch weighed 1 000 kg; 80 kg was contaminated (ceramics, stones) and 50 kg was fines. Contamination = 8%; unusable fines = 5%.
How design choices affect the metrics
- System type
- Deposit‑Return Scheme (DRS) / Bottle Deposit: typically gives high recovery rates and cleaner cullet because people return whole containers for money. Often raises recovery to high levels (>60% in many systems), but needs legislative and financial set‑up.
- Bring systems (bottle banks): moderate recovery, good quality if conveniently located and well maintained. Success depends on accessibility and security.
- Curbside collection: can be convenient for households and reach high coverage, but quality varies; separation at source helps quality.
- Buy‑back centres / buy‑back trucks: work well where informal collectors are active; can improve inclusion and throughput.
- Informal collection (scavengers): can deliver large volumes but often fragmented; quality varies; inclusion and fair payment are key.
- Frequency and container type
- Frequent collection (weekly) reduces home storage and dumping; improves participation.
- Lockable, labelled bins reduce mixing/contamination.
- Clear signage (what to put in) reduces contamination — especially important where multiple recyclables are collected.
- Location & convenience
- Closer drop‑off points raise participation and coverage.
- Good lighting and security reduce theft and vandalism (keeps system functioning).
- Incentives & behaviour
- Monetary incentives (DRS, small payments) drive higher recovery and better sorting.
- Non‑monetary incentives (education, community pride) help but usually at a slower pace.
- Integration with informal sector
- Formal systems that work with collectors (payments, collection points) gain volume and local legitimacy and can improve quality if sorted at source.
Simple measurement methods & tools for small pilots
You don’t need high‑tech gear. Here are practical, low‑cost options.
- Weighing
- Best: weighbridge at the transfer point or recycler.
- Low‑cost: platform scales (up to 150–300 kg) for sacks/crates; calibrated bathroom scales for counts converted to weight.
- Tip: If you count containers, do a small sample to get average weight per container by type (e.g., 330 ml beer bottle ≈ 170–200 g; 750 ml wine bottle ≈ 400–600 g). Multiply counts by average weight.
- Counting
- Use counts in markets or collection points if weighing isn’t possible. Convert to mass using sample weights.
- Keep simple logs: date, collector, source (household/market), container type, count, estimated weight.
- Simple contamination checks
- Every 5th load inspect and record % non‑glass by visual estimate or by separating a small test portion and weighing contaminants.
- Coverage & participation
- Use household lists or a simple map. Track number of households using service each week.
- For businesses, track number of participating outlets and volume collected.
- Data sheets (simple fields)
- Date | Collection point | Collector name | # sacks/loads | Mass (kg) | Estimated contamination (%) | Destination (recycler/stockpile)
- Frequency and duration
- Run pilot for at least 3 months to capture behaviour patterns; 6 months is better (captures seasonal differences).
Sampling and data quality tips
- Standardise: use the same scales, methods and definitions throughout the pilot.
- Train data collectors: short training on how to weigh, count and record.
- Spot checks: supervisor checks one in ten records for accuracy.
- Avoid double‑counting: tag loads or keep simple trip logs (who picked up what and where it was delivered).
- Record losses: theft, blowaways, split sacks — note them so you can explain discrepancies.
- Simple audits: once a month, do a mini composition study of a 50 kg sample to estimate contamination and usable cullet fraction.
Counting the informal sector: practical approach
- Map collectors: get a list of active collectors or buy‑back centres in your area.
- Use interviews: ask collectors their daily/weekly average and verify with spot checks.
- Offer to record purchases: at buy‑back points, keep a simple log or weigh purchases for a month to get real numbers.
- Inclusion tip: pay collectors promptly, provide safe weighing facilities and PPE, and recognise them in reports — this improves trust and data quality.
Simple KPI targets and benchmark ranges (approximate)
These are approximate ranges to use in pilots; real numbers depend on context.
- Recovery rate (pilot): 20–60% — low where no incentives and inconvenient access; higher where DRS or active buy‑back exists.
- Collection coverage (serviced households): 40–80% for mature local systems; lower for new pilots.
- Cullet share (manufacturing): 20–60% common for container glass plants; some plants use >70% when quality and supply are steady.
- Contamination rate: aim for <5–10% contamination for direct remelting; above ~10–15% may require extra sorting and cost.
Use these as conversation starters — not hard rules. Benchmarks should be localised.
Safety, gender and inclusion considerations for measurement
- Safety: provide gloves, masks, closed shoes and first‑aid for collectors handling broken glass.
- Gender: many informal collectors are women. Design collection times, locations and payment methods that work for caregivers and those with informal work hours.
- Accessibility: ensure drop‑off points are safe and reachable for the elderly and people with disabilities.
- Payment methods: cash is fine, but mobile payments increase transparency and safety if local users have phones.
Quick classroom/practical activity (15–30 min + field task)
- In class: split learners into small teams. Give each team a mock data sheet and a bag of counted sample bottles (or photos).
- Task: estimate total mass for a day using counts converted to weight; calculate recovery rate using an assumed waste generation figure.
- Field task: each team runs a simple one‑week pilot at a community collection point. They record daily weights, counts and contamination, then present the recovery rate and two recommendations to improve performance.
This helps learners practice simple data collection and see how design choices affect results.
Simple data sheet template (one line per collection event)
- Date
- Collector / team
- Collection point (household/street/market)
-
containers (by type) — e.g., 330 ml, 750 ml, jars
- Mass (kg) — measured or estimated from counts
- Contamination estimate (%) — visual
- Destination (recycler / buy‑back / storage)
- Notes (incidents, thefts, weather)
You can give learners printed sheets or a simple spreadsheet on a phone.
Final tips
- Start small, keep methods repeatable and transparent.
- Focus on a few good numbers rather than many poor ones.
- Use both volume (counts) and mass — mass matters for recycling economics, counts are useful for behaviour work.
- Report both quantity and quality: a lot of glass that’s unusable isn’t helpful.
- Involve recyclers early so cullet share targets are realistic.
If you want, I can:
- Produce a printable one‑page data sheet for learners.
- Create a short worked example pilot dataset you can use in class.
- Suggest simple teacher notes for running the field activity.