
-
Why glass matters: history and basics3 Topics
-
Where and how glass is used today3 Topics
-
State of glass waste and recycling3 Topics
-
Collection systems and actors3 Topics
-
Sorting, processing and making cullet3 Topics
-
Remelting, quality and markets3 Topics
-
Environmental, economic and policy aspects3 Topics
-
Practical implementation and teaching resources3 Topics
Participants 9


Key reports and data sources

travellingteacher256 April 13, 2026
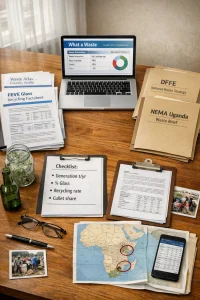
Hey — below is a practical, educator-friendly guide to the short, credible reports and data sources you can use when teaching or planning on glass waste and recycling in the Global South (and countries comparable to South Africa/Uganda). Focus is on 5–30 page briefs or concise web resources, what to look for in them, and where to find country or regional data. Use this as your quick library and a checklist for extracting the useful bits.
Quick rules of thumb when choosing a brief
- Prefer documents that are 5–30 pages (concise syntheses, country factsheets, policy briefs).
- Check the publication date and the data year(s) — prefer last 5–7 years for practical planning.
- Look for clear definitions (what “recycling rate” means, system boundary: post‑consumer only? includes cullet imports?).
- Note methodology and uncertainty (estimates vs measured tonnages).
- Prefer sources that provide: generation (t/y), % of MSW that is glass, recycling/collection rates, cullet share in production, energy/GHG savings per t cullet, and short descriptions of collection systems.
- If a document lacks raw numbers, check for references or data appendices and follow those.
Organisations and the short products they publish (useful 5–30 page briefs)
Below are the organisations most likely to have concise syntheses, factsheets or country briefs you can use directly in a classroom or planning sheet.
-
World Bank — “What a Waste” resources and country profiles
- Why useful: country waste generation, composition (includes glass share), brief country profiles.
- What to look for: "What a Waste" summary pages / country datasheets and the interactive data portal for quick numbers.
- Where: World Bank “What a Waste” (dataportal and country pages).
-
UNEP (United Nations Environment Programme) — policy briefs and regional overviews
- Why useful: short policy briefs on circular economy, materials, and regional waste challenges; often include clear recommendations.
- What to look for: briefs that discuss collection systems, informal sector inclusion, and lifecycle/energy implications.
- Where: UNEP publications / regional office pages.
-
ISWA (International Solid Waste Association) / Waste Atlas
- Why useful: Waste Atlas country pages give concise stats on municipal waste generation, recycling, and infrastructure. Very handy for quick country fact sheets.
- What to look for: country profiles, waste generation per capita, recycling-level summaries.
- Where: WasteAtlas.org and ISWA publications.
-
FEVE / Glass industry federations (Europe, Glass for Europe, Glass Packaging Institute, etc.)
- Why useful: short annual factsheets (usually 1–6 pages) on container-glass recycling rates, cullet use, energy/CO2 savings per % cullet. FEVE has excellent country-by-country recycling rate sheets for Europe — good methodological examples. GPI (US) has similar briefs.
- What to look for: % recycling rate, cullet share in production, energy savings per tonne or per % cullet, methodology note.
- Where: FEVE.org, glasspackaging.org (GPI), glassforeurope.com.
-
World Bank / IFC and regional development banks (AfDB) — short sector briefs and project summaries
- Why useful: practical project briefs describing collection systems, pilot DRS projects, value-chain interventions; often include cost/benefit highlights.
- What to look for: descriptions of collection models, role of the informal sector, financing and business models.
-
National environment agencies and ministries (examples: South Africa DFFE, Uganda NEMA)
- Why useful: country strategies, National Waste Management Strategy, legislative briefs, and often short policy factsheets. These are primary for local rules and targets.
- What to look for: national recycling targets, existing schemes (deposit, EPR, kerbside), published recycling rates, and data sources they used.
- Where: government websites, municipal waste reports.
-
Academic & policy reviews (short syntheses)
- Why useful: recent review papers and policy briefs summarise multiple data sources and note data gaps (many are 8–25 pages). Look for review articles on “glass recycling in developing countries” or “circular economy for packaging in Africa”.
- What to look for: consolidated tables, cross-country comparisons, citations to original data sources.
-
Trade & statistical databases (UN Comtrade, UNData, WDI)
- Why useful: for cullet and glass trade numbers, production/import/export data, and macro indicators to contextualise the glass sector.
- What to look for: HS codes for glass (imports/exports of cullet and finished glass), country trade flows and volumes.
Short, practical sources to check first (good for 1‑page syntheses)
These are quick hits that often have short, usable outputs:
-
World Bank — “What a Waste” country pages and datasets (interactive data).
URL: https://datatopics.worldbank.org/what-a-waste/ -
Waste Atlas (ISWA / partners) — country profiles and short maps.
URL: https://www.wasteatlas.org/ -
FEVE — “European container glass recycling rate” factsheets and country sheets (short PDFs).
URL: https://feve.org/ -
Glass Packaging Institute (GPI) — short factsheets on glass recycling rates and benefits (US-focused, but good metrics).
URL: https://www.gpi.org/ -
UN Comtrade — trade data (useful to check cullet imports/exports).
URL: https://comtrade.un.org/ -
National: South Africa Department of Environment, Forestry and Fisheries (DFFE) — National Waste Management Strategy and factsheets.
URL: https://www.environment.gov.za/ (search for “National Waste Management Strategy”) -
National: Uganda National Environment Management Authority (NEMA) — waste management briefs and environment reports.
URL: https://www.nema.go.ug/ -
Regional/NGO briefs — search for short reports from organisations like WWF, Recycling Economic Development Trusts, SNV, GIZ or African Development Bank. They often publish 10–20 page project briefs on waste and circular economy pilots in Africa.
What to pull out of a 5–30 page brief (a one‑page extraction checklist)
When you read a short brief, grab these items so you can make a compact classroom slide or planner note:
- Title, author, year, and data year(s).
- Scope and definitions (what counts as “recycled” / “glass” / “cullet”).
- Key numbers (preferably with units and year):
- Glass generation (t/year) OR % of MSW that is glass.
- Collection rate (if given) and end‑of‑life recycling rate (post‑consumer %).
- Cullet share in primary glass production (%).
- Energy/GHG savings estimates (e.g., % energy saved per t or per % cullet).
- Any trade numbers (cullet import/export t/year).
- Short description of collection/processing systems (kerbside, bottle banks, DRS, informal sector role).
- Policy levers or business models noted (DRS, EPR, landfill bans, incentives).
- Data gaps and study limitations (very important to call out).
- Source of the primary data (surveys, industry records, municipal stats).
- Contact or further reading links.
Use that checklist as a template to build 1‑page briefs for learners.
How to evaluate credibility and comparability (short guide)
- Check definitions: many “recycling rates” are not comparable unless system boundaries are the same.
- Time lag matters: industry recycling figures often report a recent year but national stats may be several years behind.
- Informal sector: many briefs undercount glass recycled by informal collectors — look for qualitative mentions and try to estimate scale.
- Industry vs municipal: industry associations often report cullet use in production (which can include imported cullet) — treat that separately from post‑consumer collection rates.
- Methodology transparency: prefer sources that clearly state data sources and assumptions.
Where to find Africa / South Africa / Uganda‑level numbers quickly
- Waste Atlas country pages (search the country) — quick generation and recycling snapshots.
- World Bank “What a Waste” country pages — waste generation, composition (glass %).
- South Africa DFFE — check the National Waste Management Strategy and any published national waste statistics (NWMS often has handy summaries). Also look at municipal Integrated Waste Management Plans (IWMPs) for city level data.
- Uganda NEMA and Ministry of Water & Environment — national environment or waste reports, plus district/municipal waste studies.
- Local industry groups and recyclers — short annual fact sheets (Glass recyclers, informal sector NGO reports). These are often the best source for on‑the‑ground collection and employment numbers but check for self‑reporting bias.
Short list of useful document types to search for (practical search terms)
- “[Country] waste profile” or “[country] municipal solid waste profile”
- “[Country] glass recycling factsheet” / “container glass recycling rate [country]”
- “Glass recycling factsheet FEVE / GPI / Glass for Europe”
- “What a Waste [country] profile”
- “Waste Atlas [country]”
- “National Waste Management Strategy [country]”
- “Deposit return scheme brief [country]” or “DRS feasibility brief [country]”
- “Informal sector waste recycling brief [country]”
A suggested short reading pack to assemble for a course topic (for educators)
- Waste Atlas country page for your country — one page printout.
- World Bank “What a Waste” country datasheet — 1–2 pages.
- FEVE / industry glass recycling factsheet (closest regional match) — 1–3 pages.
- National Waste Management Strategy short summary (government) — 1–3 pages.
- One NGO/academic brief on informal sector inclusion or DRS pilots in the region — 3–15 pages.
This pack gives learners policy, data, industry, and on‑the‑ground perspectives in a compact bundle.
If you want, I can:
- assemble a 1‑page printable factsheet template you can drop numbers into, or
- pull together a recommended reading pack specific to South Africa or Uganda with links and a 1‑page summary for each source. Which would help you most?