
-
Why glass matters: history and basics3 Topics
-
Where and how glass is used today3 Topics
-
State of glass waste and recycling3 Topics
-
Collection systems and actors3 Topics
-
Sorting, processing and making cullet3 Topics
-
Remelting, quality and markets3 Topics
-
Environmental, economic and policy aspects3 Topics
-
Practical implementation and teaching resources3 Topics
Participants 9


Global generation and recycling rates

travellingteacher256 April 13, 2026
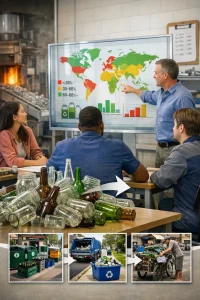
Quick intro: glass is produced and discarded in very large amounts worldwide, but how much gets recycled varies a lot by region and system. Below is a concise, plain‑English picture you can use in a lesson for educators or TVET/high‑school learners.
Summary (one paragraph)
- Global glass production is large — on the order of tens to low‑hundreds of millions of tonnes per year — and container glass (bottles and jars) makes up a substantial share of that.
- Typical reported recycling rates for glass containers vary widely: roughly 20–40% as a simple global average, with high‑performing regions often 60–80% (or higher where deposit‑return schemes exist) and many low‑ and middle‑income regions well below 30%.
- Numbers are best treated as ranges: different definitions, measurement methods and informal recovery mean there’s a lot of uncertainty. See the next sections for drivers and a plain‑English guide to why the data look fuzzy.
Key numbers and ranges (for classroom use)
- Global production (all glass types, rough scale): tens to low‑hundreds of Mt (million tonnes) per year. Container glass is typically measured in tens of Mt/year.
- Global recycling (rough range): many sources put a global average recycling rate for container glass in the ballpark of 20–40% (i.e., one‑third order of magnitude).
- Regional examples (illustrative — use local/national data where possible):
- Europe (many countries): commonly 60–80% recycling for container glass.
- North America (US): often around 30–40% for glass in municipal recycling streams.
- Latin America / Asia: highly variable, roughly 10–40% depending on country and systems.
- Sub‑Saharan Africa: generally low official rates (<10–30%), though informal recovery can be significant in places.
(These are summary ranges for teaching. If you need exact national figures, see the data sources listed at the end.)
What drives those differences?
- Collection systems: deposit‑return schemes (DRS) and dedicated bottle banks deliver the highest recovery rates. Curbside recycling rates depend on service frequency, containers accepted, and public participation.
- Economics: value of cullet, transport costs, and local glass manufacturing capacity all affect recycling viability. If remelters are far away, collection is harder to sustain.
- Market demand for cullet: remelters need cullet to reduce energy and raw sand costs. If demand is low, collected glass may be landfilled or exported.
- Product design and contamination: multi‑layer or coated glass, ceramic contamination, food residues, and broken mixed‑colour glass reduce recyclability.
- Informal sector: in many Global South settings, informal collectors recover a lot of bottles for resale — this reduces official “waste” volumes but makes national statistics messy.
- Policy & enforcement: producer responsibility laws, targets, and enforcement change behaviour quickly when implemented well.
Plain‑English explanation of data uncertainty and measurement challenges
- Different definitions: “recycling rate” can mean different things — proportion of containers placed on the market that are returned to remelting, proportion of waste glass collected, or proportion of collected glass that is actually reprocessed. Make clear which you use.
- Informal recovery is often invisible in official stats: in some countries informal collectors recover substantial shares of bottles but aren’t captured in government reports. That makes official recycling rates look lower (or higher), depending on the accounting.
- Export and import of scrap: countries sometimes export collected glass cullet or imports cullet for remelting. Trade flows complicate whether recycling happened “locally” or elsewhere.
- Stockpiling and downcycling: some collected glass is stockpiled, used for construction aggregate (downcycling) or not remelted — this can be recorded as “recovered” but not as truly recycled into new glass.
- Composition sampling and municipal waste studies are episodic: many countries only estimate composition infrequently, so data can be out of date.
- Double counting and inconsistent time frames: different agencies might report different base years or count flows differently (e.g., including industrial glass waste vs only post‑consumer).
- Quality and contamination metrics are rarely standardised: “clean cullet” vs “mixed/contaminated” matters a lot for remelters but isn’t consistently measured.
How to present this to learners (short tips)
- Use ranges rather than single numbers. Teach the idea of “order of magnitude” — e.g., tens of millions of tonnes, not exact counts.
- Point out a local example (national agency or industry group) and compare it to a European DRS example so students can see the policy effect.
- Explain the measurement caveats briefly so learners understand why two reports give different figures.
- Use three simple metrics in class: generation (tonnes/year), recovery/recycling rate (% of waste or of placed on‑market containers), and cullet share (how much of the remelt mix is recycled glass).
Where to find concise, reliable data (good short reports & pages to consult)
(These sources are useful for educators — most are public, non‑technical and contain tables/figures you can quote or adapt.)
- World Bank — “What a Waste 2.0” (2018). Global municipal solid waste quantities and composition; good for estimating glass share of MSW. (report)
- Eurostat — Packaging waste and recycling indicators (country and EU‑level pages). Short tables and charts for container glass recycling in Europe. (web pages / briefs)
- US EPA — “Advancing Sustainable Materials Management: Facts and Figures” (annual factsheets). Includes glass recycling rates in US municipal streams. (factsheet)
- WRAP (UK) — short reports and factsheets on glass packaging recycling and cullet use. Practical and straightforward. (briefs)
- Glass for Europe / Glass Alliance Europe — policy briefs and brochures on container glass circularity and recycling in Europe (useful benchmark). (brochures ~10–20 pp)
- ISWA / UNEP briefs — occasional reviews on waste management systems and recycling in low‑ and middle‑income countries; useful for explaining informal sector roles and system challenges. (briefs)
- National agencies or industry associations (South Africa’s DEA or industry recycling bodies, Uganda’s national waste reports): these are essential for local figures and usually short.
Final classroom line you can use
- “Globally we produce and discard huge amounts of glass. Recycling rates vary a lot — from single digits in some places up to 80%+ in places with strong collection systems. Differences come down to the systems in place, market demand for cullet, and whether we’re counting informal recovery or exports. Treat headline numbers as ranges, and always check what definition a report is using.”
If you want, I can:
- Draft a one‑page student handout with a simple graphic template (generation → collection → remelt) and a few country/region examples.
- Pull specific country numbers (South Africa, Uganda, EU, USA) from the latest national/agency reports and format them as a 1‑page table for learners.